HR Attrition Data Analysis with Python
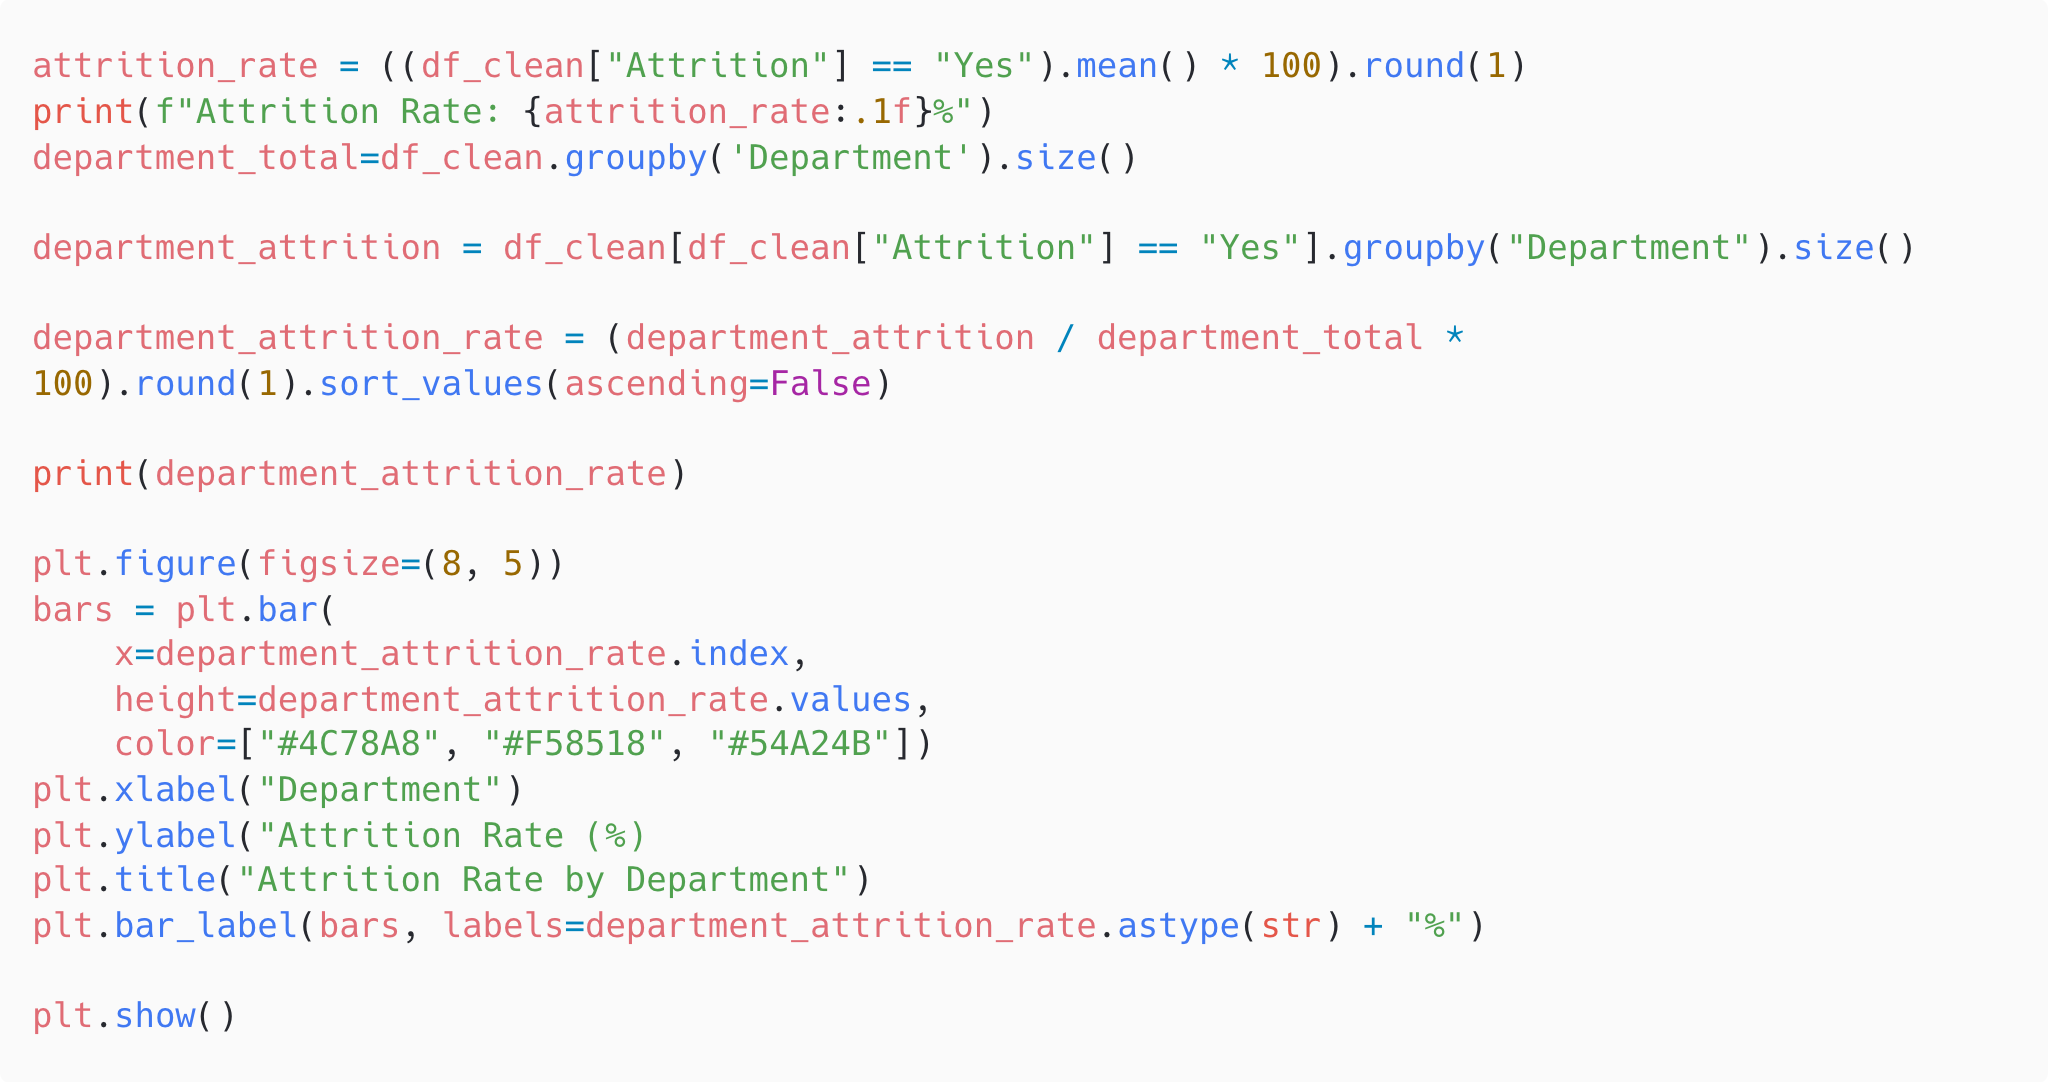
Explored and analysed an employee attrition dataset using Python.
Performed data cleaning, handled missing values, conducted
exploratory data analysis (EDA), and created visualisations with
Matplotlib to identify trends in employee turnover.
Technologies: Python, Pandas, Matplotlib, Google
Colab
HR Attrition Dashboard in Power BI
Designed an interactive Power BI dashboard to analyse employee
attrition across different departments and demographic groups.
Built data models, created DAX measures and KPIs, and developed
interactive visualisations to help identify key factors
influencing employee turnover.
Technologies: Power BI, Power Query
Chocolate Sales SQL Database
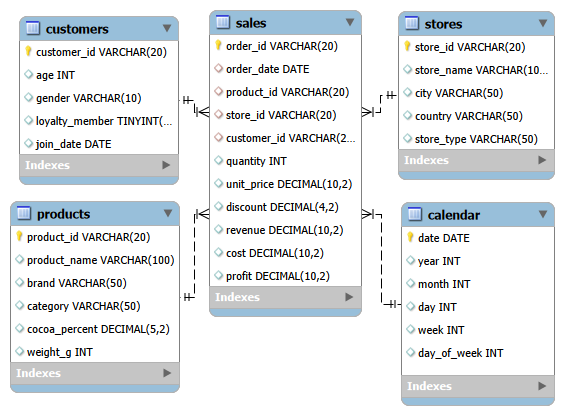
Designed and built a relational SQL database using MySQL from a
chocolate sales dataset. Created dimension and fact tables,
defined primary and foreign keys to establish relationships, and
imported data from CSV files. Performed exploratory SQL queries to
understand the dataset and laid the foundation for future business
analysis, including sales trends, customer behaviour, and
profitability.
Technologies: SQL, MySQL Workbench
Sales Analysis Dashboard in Excel
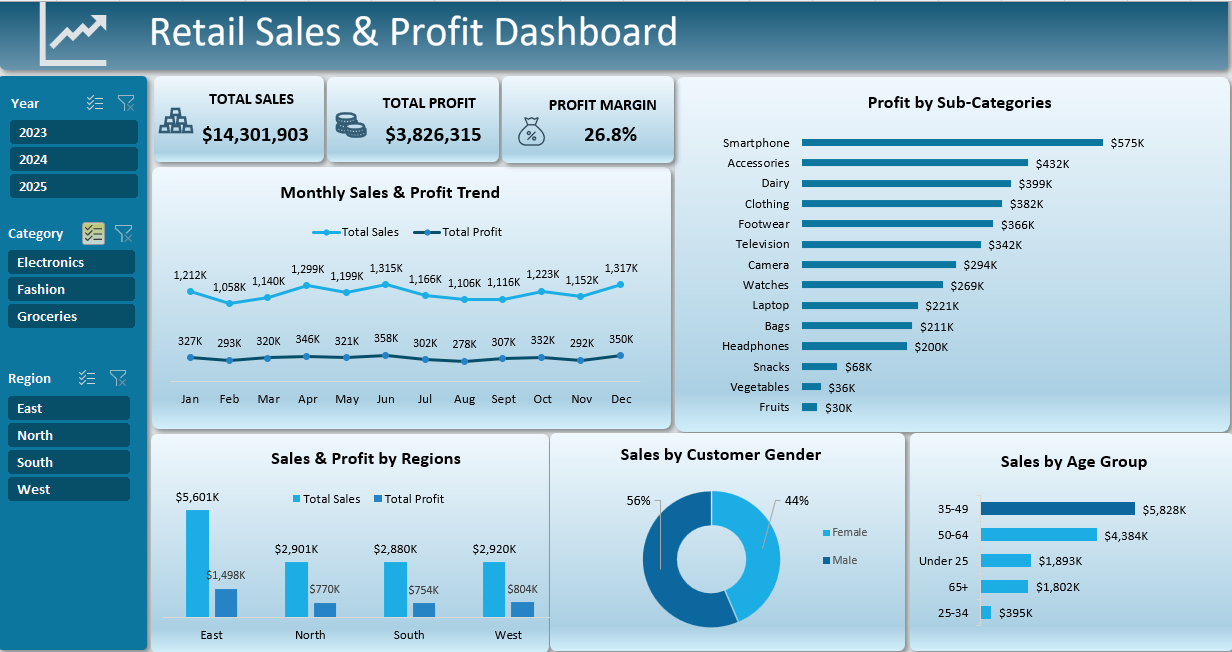
Analysed retail sales data using Excel to identify revenue trends,
customer behaviour, and product performance. Cleaned and
transformed data, created calculated metrics, and developed
interactive dashboards using Pivot Tables and charts to support
business insights.
Technologies: Excel, Pivot Tables,
charts
Global Happiness Analysis in Tableau
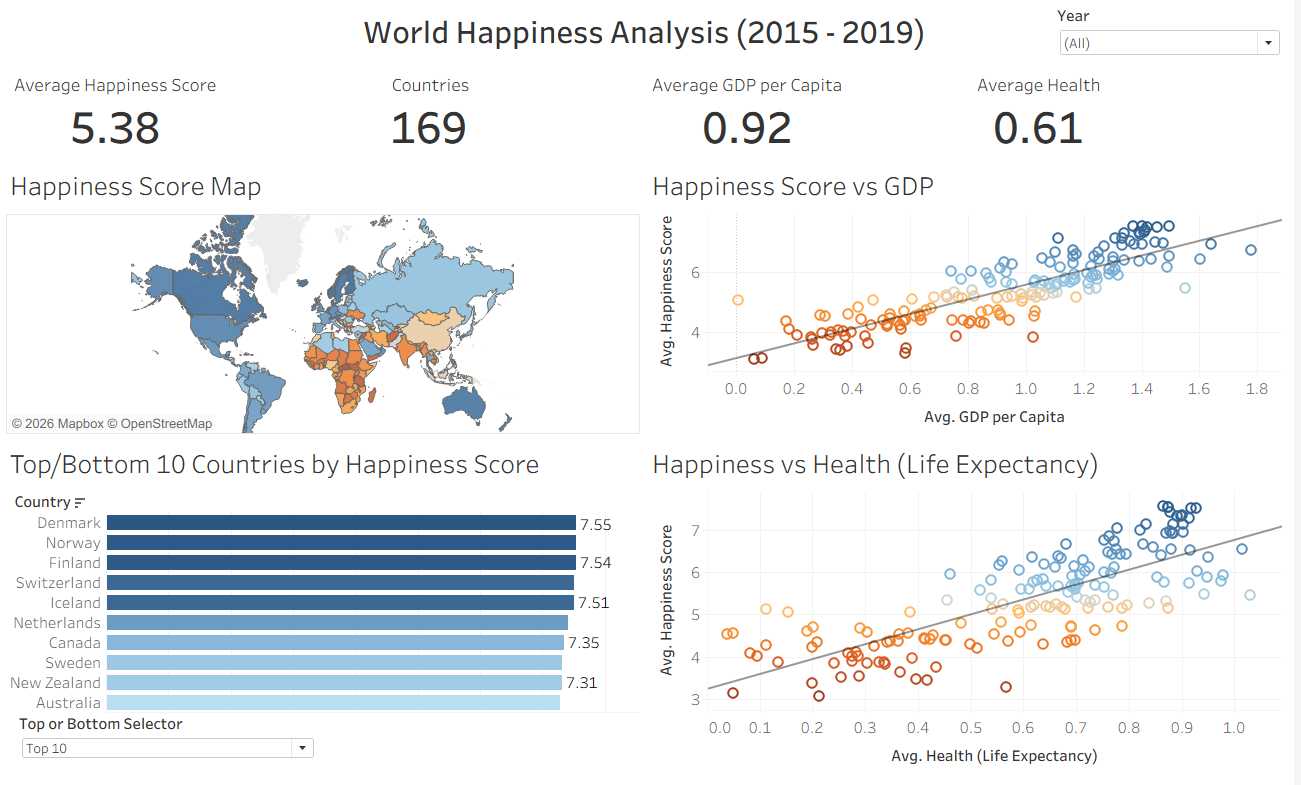
Explored global happiness trends using Tableau by analysing
relationships between happiness scores and key socio-economic
indicators. Created interactive visualisations and dashboards to
compare countries, identify patterns, and communicate data-driven
insights.
Technologies: Tableau, Power Query